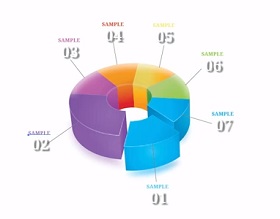
Diagrams and statistics are an essential part when you want to illustrate a complex project. This video tutorial shows you how to create a colorful 3D pie chart. We will be using Adobe Illustrator with the 3D Extrude and Bevel tools.
Related Posts
Rapid Vector Portrait Process in Illustrator
Il tutorial che vedrete vi guiderà attraverso il processo per fare rapidamente un ritratto vettoriale. Una maschera sarà utilizzata come guida per le zone più chiare e quelle scure. Utilizzerete…
Create Stop Motion Title Effect in After Effects
In this interesting video tutorial we will see a lesson that shows us how to create a beautiful stop motion effect within Adobe After Effects. An effect with which you…
Texturing and Rendering Anime Characters in Blender
This video tutorial shows you how to tackle 3D anime character style texturing and rendering in Blender. A good lesson for creating fantastic characters.
Draw a Cute Vector Cactus in Adobe Illustrator
In this video tutorial we will see how to make the vector drawing of a cute very simple cactus using the Adobe Illustrator graphics program. A very detailed and easy…
Set Grids in ’60 Seconds with Adobe Illustrator
In this small 60 second video tutorial we show how to set up the work grid in Adobe Illustrator. An operation that we sometimes take for granted but it is…
Draw a Retro Long Shadow Text Effect in Illustrator
In the steps of the tutorial that we will follow we will learn how to create a text effect with long shadow in retro style with Adobe Illustrator. An exercise…


